

In the past two weeks, Austria and the Czech Republic became the latest countries with an election that showed voters’ political preference clearly swinging to the right. In Austria, Sebastian Kurz of the conservative People’s Party won the largest share of the vote (about 31.5%) and while this result is troubling for the incumbent Socialist Party of Austria (they won just 27%), what is concerning many is the fact that Kurz is most likely going to form a coalition with the far-right Freedom Party - a party found in the 1950’s by former Nazis.
To the north, Andrej Babis lead the ANO party (roughly translated to Action for Dissatisfied Citizens party) to a commanding win and now controls close to 40% of the Czech Republic’s Parliament. Babis is a billionaire tycoon who focused his message on ridding the capitol of corruption, bringing back jobs, dialing back involvement in the EU, and halting immigration. Sound familiar?
Since the Brexit vote in the U.K. last year, we have seen continued success across Europe of right-wing, populist candidates. This includes the rise of Marine Le Pen in France, and the AfD (Alternative für Deutschland) giving a far-right party seats in the German Bundestag for the first time in decades. Clearly the United States has also been part of this pattern, with the still-shocking victory of Donald Trump and his unique brand of conservative national populism.
While the rise of right-wing populism is undeniably on the rise, what we began to wonder is: outside of the end results, are there patterns between the voters in the recent national elections in the U.K., U.S., France, and Germany? We would include Austria and the Czech Republic in the analysis, but so far, detailed results of these elections have not been made available.
For this report, our hypothesis is that there is likely to be a common thread between these results, as this result in one country can be a fluke, but six of these types of outcomes are not a random occurrence. We know that in all six countries, forgotten positions have now resurfaced from the last century, although with new names. Clearly conservative-leaning parties have been successful in the past, but this is a new brand of conservativism that seems to have moved past the typical focus on free market principles and limited government involvement. Instead, this new strain involves a clear scapegoat (immigrants/refugees) and a push for isolationism from the rest of the world. This isolationist view is not unique to history, but given the current global economy, it does feel even more out of place that in the past. The focus on saving jobs and protecting a “lost culture” has turned this movement into a uniquely backwards-looking brand of populism, that seems more interested in turning the clock back than moving the respective country forward.
With that being said, our question became: what are the commonalities that exists and, assuming there is at least one, what does this mean for future elections in these counties and other Western countries?
As a quick recap, in the U.S., Trump won the Presidential election with 306 electoral votes against Hillary Clinton’s 232, although he lost the popular vote, 46% to 48%. In Britain, 51.9% of the electorate voted to leave the European Union last year and in the first-round of France’s Presidential election this past May, Le Pen obtained 21.5 % compared to Emmanuel Macron’s 23.8%, although in the second round he became the youngest French president with 66.1% of the vote. Last month, elections in Germany saw the first alt-right party in parliament since the 1960’s, when the AfD won 12.6% of the vote and 94 parliament seats, drawing in voters from all the big parties.
Given the different nationalities and cultures, we decided not to factor in different election systems or exact results (i.e., Trump winning 46% of the vote versus AfD winning 13%), as normalizing these results would be nearly impossible. Instead, we decided to look at the demographics behind these results and what patterns exist across the four countries.
Based on the data we had available to us we decided to look at density of the population (rural versus urban), age, income, and education. As you will see, some demographic patterns exist in one, two, or three countries but not all four, while one demographic was a driver across all four countries. After looking at these results, we are unfortunately even more concerned about what the future holds and what divisions will begin to be cemented, both in the U.S. and around the globe.
Population Density (Urban vs. Rural)
In the United States, a lot of focus after the election was on the divide between the bigger cities and rural areas across the country and within specific states. As we discussed in a previous piece, the shifts in rural areas in swing states like Wisconsin, Pennsylvania, and Michigan were significant. Given this, we decided to start our analysis here.

This urban-rural divide in the U.S. is not a new phenomenon, but the 2016 election accelerated previous patterns. As shown in this NYT’s graphic, not only is the density of an area an excellent predictor of results in the United States, but the change from 2012 to 2016 was shocking. In the urban cores, Clinton won by 72.5%. In the rural areas she lost by 84.6%. In fact, everywhere outside of the urban centers was not friendly to the Clinton campaign.
Looking at the county-by-county breakdown across the United States, the pattern is incredibly clear.

In France, the second-round’s gap between the candidates shows a similar pattern. Macron’s margin of victory in the densely-populated areas was almost twice that of in the rural areas. According to INSEE and the Interior Ministry of France, Macron racked up an advantage of 40.6% of the votes in densely populated areas, compared to just 19.2% in the sparsely populated areas.

In the U.K., electoral districts with densities of 40 or more electors per hectare (1 hectare equals about 2.5 acres for those who forgot their classes on obscure medieval measurements) voted to remain in the E.U., including several big cities: London, Cardiff, Leeds, Manchester and Liverpool. In the U.K., as in France, the further you got from the city center, the stronger the nationalist vote became.


With three of the four countries following a similar pattern, we then moved to the German election. There are a few things to note before we dive into the numbers. First, the German election system is a little more complicated than others, and of the four elections we are looking at, Germany was the only election with a non-binary choice. With this in mind, we decided to look exclusively at where the AfD gained support and not factor in the relationship to where the two main parties, the Conservative Christian Democratic Union (CDU) or Social Democrats (SPD), ended up.
As shown by the map from Bloomberg Politics, we can certainly see a concentration of support for the AfD in Saxony, the southern portion of what was East Germany. Even in this area of the country, we see a slightly lower level of support in the bigger cities in this state (Leipzig and Dresden), the pattern is not as clear as in the other three elections discussed above. Further, we see a similar level of support for the AfD across the remaining states as well as in some of the bigger urban areas such as Berlin, Munich, Hamburg, and Cologne (shown at the bottom of the graph).
In the end, in three of the countries there was a clear divide when it comes to population density, but the data is inconclusive in the other.
Age
Next, we decided to look at age and see if there was a consistent generational divide across the four election results. In the U.S., voters under the age of 30 went the strongest for Clinton, while a majority of voters between the ages of 30 and 44 pulled the lever for the Democratic candidate as well. As the chart below shows, voters over the age of 45 moved toward Trump decisively.

Interestingly, the vote share held steady in the U.S. between those 45 to 64 and those over the age of 65. Also of interest in the U.S. is the much larger portion of voters under the age of 45 voting for a third-party candidate.
This pattern presented itself almost identically in the Brexit vote. As we see in the chart below, a majority of voters under the age of 45 voted to remain, while those over the age of 45 were more inclined to leave the E.U. Unlike in the U.S., in Britain we saw the support for leaving increasing as the age ranged went higher (versus a more flat-line in the U.S.). Regardless, the similarities are striking.

In Germany, Merkel performed well among voters over the age of 60, as did the SDP; however, the pattern for the AfD had not clear trend from young to older voters. Indeed, as the chart from Die Ziet shows, AfD won about 10% among voters 60 and over, but did better among those in the two middle age groups. Further, the AfD did better among the under 30 cohort than they did among the 60 and over.

As we can see with this data, age was a key dividing line in the U.S and U.K. elections, but not in Germany, and the result in France was even more unique. In the first round, 21% of young people (18-24-year-olds) cast their vote for Le Pen, while in the second round, it increased to 34%. On the opposite end of the age spectrum, there was a clear preference among voters 70 years old and older, with 78% voting for Emmanuel Macron and just 22% voting for Marine Le Pen. Unlike the U.S./U.K. elections, where the populist share of the vote increased with age, in France the reverse was true with the National Front enjoying their highest level of support among 25-34 years old (40%) and 35-49 years old (43%). Support tanked after the age of 40 for Le Pen. As the chart from the Economist shows, the results by age were eerily similar in the U.S. and U.K., but were very different in France

Income
In the past, populist movements have oftentimes attracted lower income members of a given society, focusing on a brighter future for all. This new version of populism, however, is different in that it generally is focused more on rolling back the clock rather than looking to move society forward. With the promise of a brighter future, it is not surprising that in the past this messaging would resonate strongly with those at the lower end of the economic spectrum, and less so with those at the top end. But with this new backwards looking populism, we were unsure if the expected results would hold.
In the U.S. election, there was a meaningful difference between both Trump and Clinton support when we look at the highest and lowest earners. Indeed, Clinton won 53% of the vote among the bottom fifth of U.S. earners. Trump, on the other hand, won just 41% of this cohort. When we flip to the top income brackets, Trump’s support increased by 7 points and Clinton’s dropped an almost equal 6 points. Basically, this was the reverse of what we would expect with a populist message.

Interestingly, in Britain, we saw a more expected result when it came to income differences. Those at the bottom fifth of earners voted overwhelmingly to leave (68%) while just a third (32%) voted to remain. When we look at the top income earners, the numbers almost reversed with just 39% voting to leave and 61% voting to stay.
In Britain, the relationship between these two groups was almost perfectly mirrored. As shown in the chart below, in areas with a median annual income of over £30,000 (unlike in the U.S., income is typically reported post-taxes in the UK and most of the EU) a majority of voters wanted to stay in the E.U., while 70% with a median annual revenue less than £15,000 voted in favor of Brexit.
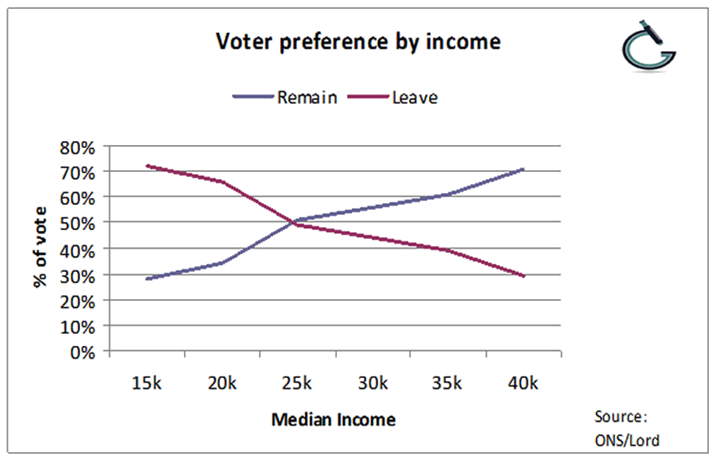
In the U.K.’s European Union referendum, every area where 40% or more of the local population earned less than £22,000 a year mostly preferred Leave. Only 30% of those with a median annual income of over £40,000 voted for Leave. In the U.S., Trump voters were not clear cut on these economic lines, with a significant part of Trump’s constituency composed of high income voters with incomes of more than $100,000 and $200,000.
In France, the results were much closer to Britain than they were to the U.S. Le Pen won in low-income areas and most of her voters have median incomes of £25,000. Interestingly, for each 1,000-euro drop in the median income in a given area, Le Pen’s support went up nearly 2 extra percentage points. Furthermore, in the districts where Le Pen won, the jobless rate was 58% or higher. Clearly, income was a factor in the French election as well.

Support for the AfD in Germany tended to mirror support for Trump in the U.S. Across the country, unemployment is, surprisingly, negatively associated with AfD votes. However, the Nationalist movement has supporters with lowest median household incomes as well as higher earners. Overall, the mean income level of AfD supporters was towards the bottom compared to the other parties, but as we see in the chart, there was a relatively large spread when it comes to the income levels of the party’s supporters.
As was the case with age and density, we see a mixed bag when it comes to income. Two elections (U.K. and France) had a strong correlation between income and voting for a more conservative populism, while in the remaining two countries there was no such parallel.
Education
Finally, we looked at education level. Oftentimes, education and income are closely associated, so we were expecting to see comparable results to what we saw using that data set. Interestingly, this was not the case. In fact, education was the best predictor of who someone would support across all four countries. Those with a college degree or university-level education largely rejected right-wing populist parties and ideas, while those without a degree were more likely to gravitate towards the right-wing populist message.
In the U.S., according to exit polls, 6 in 10 voters did not have a college degree; of this group, 52% of voted for Trump. Diving further into the numbers, Trump’s margin among whites without a college degree is the largest among any candidate since 1980. As the chart below shows, non-college voters gave Trump an 8-point margin (a 12-point swing from 2012). Among college educated voters, Clinton won by 9 points, a 7-point increase over 2012. When we look at white voters only, among the non-college educated cohort, Trump won by 39 points (a 14-point increase since 2012). Among college-educated whites, Trump still won, but only by 4-points, a 10-point drop since the last presidential election.

Across the pond in the U.K., Leave prevailed among lower educated people: Independent News reported the more educated a voter, the higher the possibility they voted for Remain. As one can see in the chart to the left, the relationship is nearly a perfect predictor.

In France, Macron fared better than Le Pen among voters with an undergraduate degree or higher. However, voters with this level of education preferred Mélancon, Hamon and Fillon in the initial round. The being said, in the second round of voting, Macron won 84% of the vote in the top 10% most educated communes, while Le Pen’s party was preferred by less educated voters. Although the relationship between the two is not as close to the near perfect results we saw in the U.K., the French results were not far off.

In Germany, those with a college degree tended to vote for the candidates from the CDU, CSU, Greens, and SPD. Conversely, AfD’s constituency is composed of a majority of non-college educated voters. Indeed, when you look at the difference between the overall electorate and those with a college degree in Germany, the Left, Greens, and FDP all overperformed among the higher educated cohort. And while supporters of the SPD and CDU/CSU tended to be more non-college educated, the difference among AfD supporters is stark. In fact, AfD supporters who did not have a college degree more than double the numbers of those that did.

Conclusion
Looking at the four demographic groupings gives an interesting view of what happened in these four elections. In the U.S., Population Density, Age, and Education played a significant role in the results. In the U.K., all of the factors we looked at had a significant impact on the outcome; the same goes for France, apart from age. On the other hand, in Germany, support for the AfD tended to be only easily predicted by education.

While each country has a unique set of circumstances and populations, the consistent attraction to this new right-wing populism is troubling. As the economy continues to change and move more and more to a tech-based economy, a college education becomes more and more critical. What is troubling in the U.S. is that we are currently in a realignment of our political parties; results like this point to a high likelihood of one party becoming the party of the college educated, while the other becomes the party of those without a college degree. We would argue this is not a good thing for the country.
With the clear divisions on Brexit, the U.K. has their own set of problems to deal with; in France and Germany, with their multiple party Parliamentary systems, there will have a reliance on power sharing agreements that could mitigate a ruling faction that has, or does not have, a college degree while those out of power are the reverse. The U.S., with a two-party system and Electoral College system, is seemingly heading down a path that could end very poorly if opposite viewpoints continue to retreat to their own sides and refuse to even utter the word compromise.
Regardless of what the future holds, the results from these four elections are fascinating. Where the right-wing populism goes from here is anyone’s guess, but we would bet that this view will continue to grow among those without a college degree across the western hemisphere.