

With about six weeks to go before the November election it is feeling safe to say that this is a year like no other. Through the first five months of this year, it looked more likely than not that the Democrats were going to have a bad night. The debate was between a terrible outcome or a really bad night. Historically there was little hope of an expansion of seats in Congress. Since 1934, the party in charge of the White House has gained seats in just three elections (1934, 1998, and 2002). In each of these instances there was a mitigating circumstance: the Great Depression, the Impeachment of Bill Clinton, and 9/11 and the War in Afghanistan respectively.
Additionally in the past if the perception of the economy was not faring well in public opinion, the party in charge is rarely rewarded with additional seats. At the beginning of 2022 29.8 percent of Americans felt the country was on the right path, a number that held relatively steady through April, according to the Real Clear Politics average. Further data that pointed to a blood bath for the Democrats was the fact that President Joe Biden had been under water when it came to his favorability (the negatives outweigh the positives) since August of 2021.
Historically when the sitting President’s favorability rating is under 50% going into an off-year election his party has gained seats exactly zero times. Similarly when inflation has been above 2% in an election year, the sitting president’s party has never gained seats.
All of this just looked bad for Democrats, but then June rolled in and the Supreme Court overturned Roe v Wade sending a shock to our country as a whole, and changing the trajectory of the upcoming election. Since the ruling, Biden’s net favorability went from -20 to about -10. In late June Republicans had a 4.3-point average in the Real Clear Politics average generic house question nationwide. Since then, Democrats have moved ahead and now hold a one point advantage.
Typically at this point in the election cycle there is a clear narrative developing around what is likely to happen in November. One side has a clear advantage and the wind behind their backs, while the other party starts to circle the wagons and hopes to mitigate the damages. This year, we now have two counter-acting forces that are making the tea leaves murky at best. On the one side you have close to a century of data, high inflation, and an unpopular President. On the other you have the overturn of Roe and those who feel strongly against authoritarian desires of the current GOP.
Six weeks is a lifetime in politics, but as of right now it is anyone’s guess of what will actually happen on November 8th. It could be Republicans taking over the House and Senate. It could be Democrats holding the House and expanding by a seat or two in the Senate (best case scenarios in our estimation), or it could be a split decision with the Democrats expanding their Senate majority and losing the House. Can’t wait for the spin on that outcome.
To try to get a better idea of what is happening in the electorate, we recently asked one of our national panels their thoughts on the upcoming Election and not just what they want to have happen, but what they think will happen.

We took a page out of our friends at Trendency’s book and didn’t just ask who are you voting for, but what are the chances you are going to vote for a candidate of the two major parties. This allows for more nuance, and also a better understanding of what voters are more likely to do in November. As the chart above shows, voters say there’s nearly a six in ten chance they’ll vote for a Democratic candidate, while there’s just a four in ten chance of them voting for a Republican. These are nationwide numbers, but regardless, good news for Democrats.
That being said, averages can sometimes mask what is really going on. Breaking this number down, the chart shows more of an advantage for the generic Democrat. They have a 10-point advantage when it comes to those who are 100% sure whom they will vote for, and a 14-point advantage when it comes to those leaning in one direction. Also worth noting here is that given everything that is going on in the world, there are still 15% of voters who say they are 50/50 on who they will end up voting for.

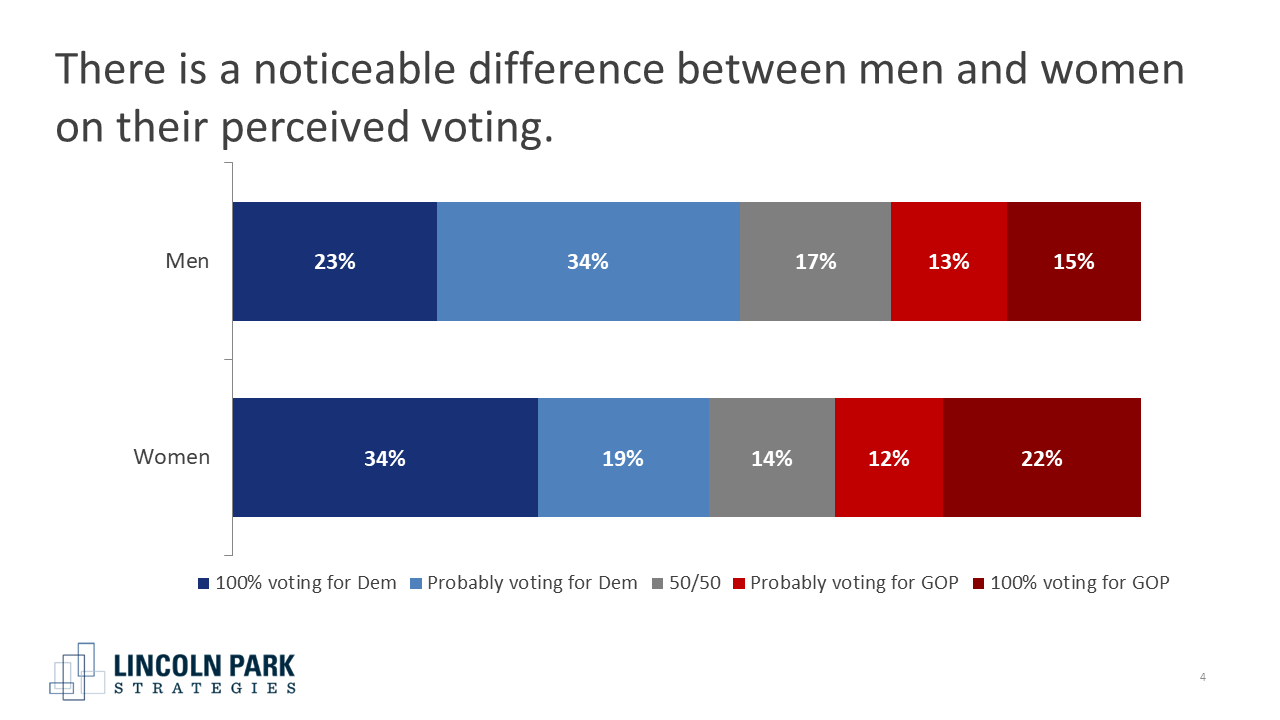
Unsurprisingly we find that there are distinct differences when it comes to different demographic groups. For example, gender plays a significant role in how voters are planning on voting. While Democrats are preferred among both men and women, women are more likely to be absolutely certain they’re voting for a Democratic candidate by an 11 point margin. At the same time, women are also much more likely than men to say they are 100% voting for the Republican candidate by a seven point margin. A third of men are leaning towards voting for the Democratic candidate. Arguably, this is likely to be the group that decides the outcome of the election. If these men end up going with the Democratic candidate it should be at least an OK night for the party, if they head in the other direction it won’t be good for team Blue.
But before we paint female voters in a broad brushstroke, once we add age into the analysis we see a less universal view.

Women 65+ have basically made up their mind. They are strongly behind the Democratic candidate (a 13-point advantage among those who are 100% certain of their vote), and there are relatively few voters leaning in one direction, and almost no 50/50 voters. As you move down the age categories the picture changes with women under 45 much more split although still with an advantage to the Democratic candidate. These numbers appear to point to a lot of churn but when we look at who these voters voted for in the 2020 Presidential cycle the numbers look fairly stable.
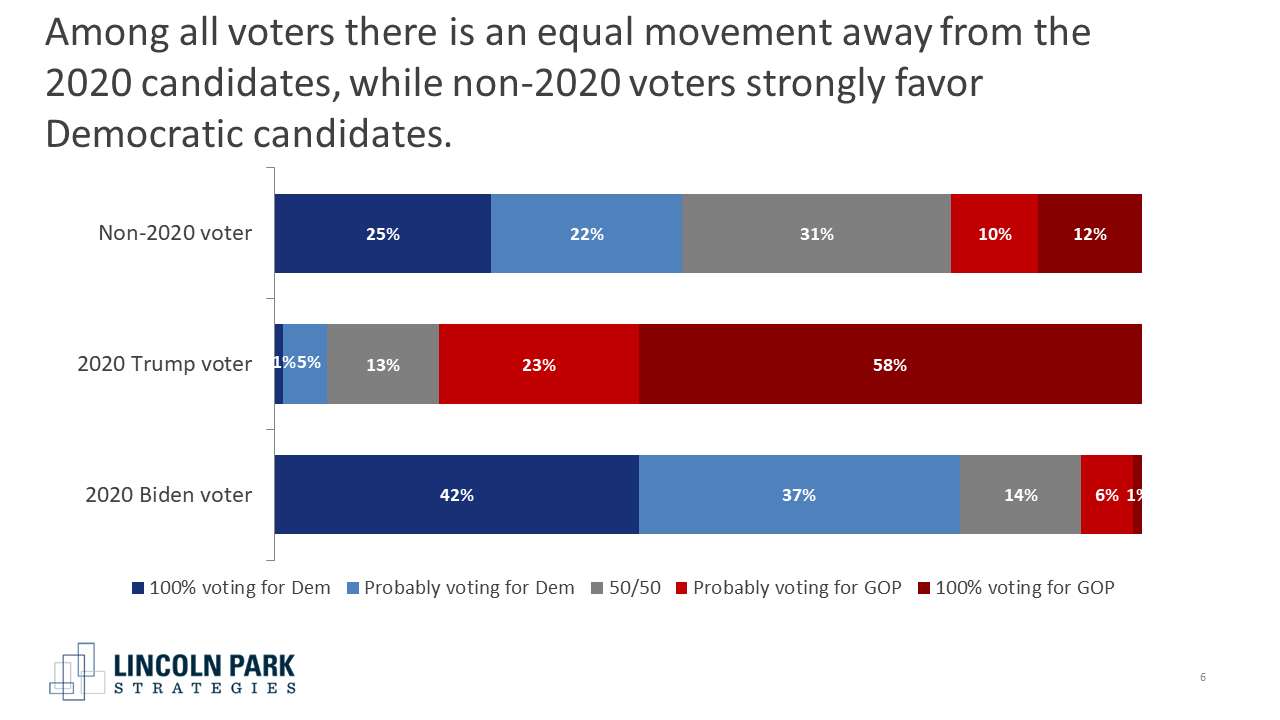
Indeed, while Trump voters are more certain that they will vote for the Republican again this year than Biden voters are certain they’ll stick with the same party (58% positive compared to 42%), there’s an equal number of both Trump and Biden voters who are unsure or who think they’ll vote the opposite way. Further there are only a handful who are certain they are switching parties. Interestingly we see that non-2020 voters are almost twice as likely to say they are definitely voting for the Democratic candidate versus the Republican. Now whether these voters turn out or not is an entirely different question.
To keep things interesting we also asked voters what their ideal outcome is for the election. Again, we see a distinct advantage for the Democrats with a majority hoping that Democrats will retain both chambers of Congress, compared to just 22% who want the GOP to be in control of both. 12% are hoping for a split decision and a similar 15% are unsure of what they want.

In general people who are positive about whom they are voting for want to see that reflected in the eventual control of Congress. However, an interesting number to look at is the percent of those who are unsure of their vote but know who they want in charge. Just about half (49%) want Democrats to keep both (fairly certain which way they will lean), while just 7% want Republicans to gain control. The interesting question is what do the 21% who want a split decision do with their vote? And do the 23% of undecided voters who are unsure of who they want in control still turn out or do they stay at home?

While much of this data points to an advantage for Democrats (usual caveat of nationwide numbers are not a perfect predictor of what is going to happen district by district) there is a little cold water to throw on the left side of the aisle. Voters tend to be very astute when it comes to predicting what is going to happen in their state and in their district. In fact in 2016 voters in our panels correctly predicted the winner in all of the states we were tracking.
When it comes to the 2022 elections, voters in our nationwide panel are less bullish on Democrats’ chances.

As the chart above shows, 2 in 5 think that the Democrats will keep both chambers. 1 in 5 think it will be a split decision, and less than 1 in 5 think the GOP will take over both. Almost 1 in 4 are unsure. Clearly, even your average voter is confused about what their counterbalancing forces predict. That being said, most Americans are expecting their ideal outcome will become reality this November.
Indeed, seven in ten of those who want Democrats to retain both chambers expect it to happen. Three in five of those who want a split Congress believe it will happen, while two-thirds of those who want Republicans to take over both chambers think it will happen.
It’s murky out there, but we will continue to keep an eye on the numbers. One thing is for certain, the chance of a big wave election for the Republicans seems unlikely at this point (as does a blue wave, but not many people were really expecting that outcome).