

PHOTO: CARLOS BARRIA/REUTERS
Last week, in Part I of a three-part series, we looked at the presidential election from a national view point. In general, national polling was fairly accurate and turnout patterns were about what was expected. There were a few surprises: Donald Trump over-performing Mitt Romney among minority voters was clearly one of the big ones, but these shifts were not enough to cost Hillary Clinton the presidency. Indeed, she is going to win the popular vote by a 1 to 2 point margin. That being said, the state-by-state results were a surprise to just about everyone.
Of the six states Clinton lost which Barack Obama won in 2012 (IA, FL, WI, OH, PA, and MI), we consider four as the key to Donald Trump’s surprising victory (WI, OH, PA, and MI). We are leaving Iowa off the list since it has a relatively small number of electoral votes (6) and Florida since Obama just barely won the state and Trump’s win was narrow as well, making this year’s results not out of the “normal” range. Apart from Ohio, the race for the presidency in the remaining Rust Belt states was razor thin; in fact, Michigan was just officially called on November 28th.
In Part II of What Happened, we look at exit poll results in these crucial four states, with the aim of highlighting significant changes in voter makeup and vote when broken down into groups such as age, education, race, and gender.
Generally, we found trends that often mirror those we saw in the national exit polls. In short, we found that Clinton supporters did not quite match the Obama coalition of voters in 2012; however, these factors were magnified because of the unique demographic and economic nature of these four states. We also found that Trump did not significantly under or over-perform Mitt Romney’s coalition from a statewide vote total perspective, but he did over-perform in many specific areas of each state. Ultimately, Trump not only flipped a handful of counties from blue to red, but he also increased his margins in rural counties to a level that would either dispel any headway Clinton may have gained in more urban counties, or was enough to carry the state regardless.
All this being said, there was also a uniqueness to each state which does not allow for a blanket summary statement to explain what happened. As we said in the initial piece, we are going to need to wait for the voter files to be updated in order to have a complete understanding of what happened, but many of the theories that are floating around do not seem to hold water at this time.
Exit poll takeaways & county breakdowns
In the four states we have decided to focus on, Obama beat Romney handily in three states and the other state by a closer margin. Obama won with the most significant margins in Michigan and Wisconsin. He beat Romney by 9 points in Michigan (54% to 45%), 7 points in Wisconsin (53% to 46%), 5 points in Pennsylvania (52% to 47%), and just 3 points in Ohio (51% to 48%). Four years later, apart from Ohio, Trump scrapped by to win these states, winning by around 1 point or less in Pennsylvania, Wisconsin, and Michigan. But the closeness of the races should not cover over the significance in the movement of the vote.

A surge of support from rural voters was certainly a factor in Trump’s election this year. In these states, that surge appears to have been what ultimately put Trump over the top (we will stay away from declarative statements until we have updated voter files to look at). Remarkably, Clinton is on track to win the popular vote by unprecedented margins for someone who lost the Electoral College vote. However, Clinton was only able to flip 30 counties around the country that had previously been won by Romney in 2012[1]. On the other side, Trump successfully flipped 217 counties that had voted Democratic in 2012.
As the election is decided by the Electoral College and not the popular vote, it is crucial to understand the weight of more rural and less populated counties to Trump's success. In the end, as illustrated by the maps below, these decisive counties have remarkable concentration centers mainly in the mid-west and upper northeast. But the counties that flipped from blue to red are just part of the story. The other, as shown in the second map, is the level of support Trump received in already red counties. Yes, the populations can be relatively small, but with Clinton running 15 to 20 points behind Obama, the numbers begin to add up quickly.
The two maps below provide an excellent picture of what happened on November 8th. The first national map shows which counties flipped from 2012 to 2016. The concentration of the Republican flips within the Rust Belt states is remarkable, as is the small number, and lack of concentration, on the Democratic side. By contrast, the red on the map is highly concentrated geographically in places like Iowa, Wisconsin, Michigan, Maine, and Minnesota.

The second map below focuses on the counties that moved in favor of the Republicans by even more extreme margins, 25 points or higher. Although the data for the map excludes Wisconsin, the counties are almost exclusive to the Rust Belt and Midwestern portion of the United States. There is clearly some overlap between the two, but what is especially notable are the "Coal Counties" in Southeast Ohio, and Western Pennsylvania as well as the counties in the upper portion of Michigan. As we walk through these four states, it is important to keep this bigger picture in mind since the pattern was very distinct.

With this information in hand, let's move to the four states in question. For each we look at two sets of data, first, the numbers from the exit polls and determining changes among demographic groups, and then a geographic perspective.
PENNSYLVANIA
Looking first to Pennsylvania, a few things jumped out at us from the 2016 exit poll data. First, while only consisting of 6% of the voter makeup, Latino voters backed Trump in higher numbers than they backed Romney (22% and 18% respectively). The drop for Clinton was even more pronounced, with 74% of Latino voters in Pennsylvania supporting her compared to 80% who voted for Obama four years ago. Additionally, white men made up the same percent of the voter share (38%) but supported Trump by a 4-point higher margin than Romney (64% vs 60%) and supported Clinton below the level that they supported Obama (32% to 39%).
In what will become a pattern throughout this piece, we also see a significant shift among voters who are non-college graduates in Pennsylvania. Though they made up the same percentage of the electorate in both elections according to the exit polls (52%), non-college graduates dramatically shifted from voting with the Democratic Party to the GOP. In 2012, 57% of non-college graduates sided with Obama, while only 42% supported Romney. In 2016, just 45% supported Clinton, a 12-point loss for the Democrats. In contrast, Trump received 52% of votes among non-college graduates, a 10-point gain for the Republican.

In 2016, as of the writing of this piece, Trump beat Clinton statewide by less than one point, 48.8% to 47.6%. Libertarian candidate Gary Johnson took nearly 2.5% of the vote in Pennsylvania, and Green Party candidate Jill Stein took just under one percentage point (.8%). In 2012, Obama beat Romney in Pennsylvania by 5 points, 52% to 47%. When we break down the vote share by county, Trump had a remarkable advantage in most counties, namely those in more rural areas of the state. Clinton, on the other hand, had an advantage in the more densely populated urban counties such as Allegheny County, home to Pittsburgh, as well as the counties surrounding Philadelphia such as Chester, Montgomery, and Delaware.
In a swing state like Pennsylvania, we see extreme differences in vote margins depending on these geographical location. To get a better sense of just what went wrong for Clinton, we can look at the counties in which Obama took home a majority of the votes in 2012 and see how in 2016, some of them just slightly slipped away from Clinton.
The first example is Erie County, located in the northwest corner of the state. In 2012, Obama swept Erie, 58% to 41%. Four years, later Trump beat Clinton by 2 points, 49% to 47%. Looking to other parts of the state, Lackawanna County is home to the city of Scranton, an industrial city that at times seemed like a magnet for Trump’s message of economic populism. In 2012, Obama received 63% of the votes in Lackawanna County compared with Romney’s 36% (Obama won by 26,579 votes). As illustrated by the maps below, in 2016, Lackawanna moved from a dark to light blue shade, as Clinton was only able to narrowly beat Trump, 50% to 47% - just a 3,491 vote difference.
To compound the problems for the Clinton campaign, while her margins were narrowing in some of these dark blue counties, Trump was expanding his advantage in the more red counties. Indeed, in more rural counties in the western portion of the state, such as Beaver and Washington counties, Trump outperformed Romney’s margins of victory over Obama. These counties, which border West Virginia, have faced difficult economic conditions as they have seen factories close and jobs disappear. In other words, these are the areas where Trump's message was hitting home the most. In Beaver County, Trump beat Clinton 58% to 38%, an advantage of 15,856 votes. In 2012, Romney beat Obama 53% to 46% in Beaver County, a difference of just 5,285 votes. In Washington County, Trump beat Clinton 61% to 36%, a margin of 24,505 votes. In 2012, in Washington County, Romney beat Obama 56% to 43%, a difference of 11,952 votes. Again, 10,000 votes here, and 10,000 votes there start to add up, especially when you consider Clinton lost the state by about 68,000 votes.
In one of the only two counties that moved from red to blue, Centre County sticks out given its location in the state. In 2012, Romney beat Obama by a razor thin margin of just 20 votes according to CNN (Obama, 33,677, Romney, 33,697). In 2016, Clinton also narrowly edged out Trump, earning 36,555 to Trump’s 35,099 votes - a 1,456-vote difference. The advantage over Obama's vote total was a rare occurrence, but again the fact that Trump was gaining ground at 10,000 vote chunks in his counties, while Clinton only increased her advantage by 1/10 of that amount in Centre County gives a clear picture of what happened in Pennsylvania.
Making matters even worse for Clinton, we can look at Philadelphia. Obama won the city in 2012 with 85% of the vote. Four years later, Clinton won the city with 84% of the vote. This doesn't seem like a significant drop, especially when you consider that Clinton won 5,000 more votes than Obama. However, when you look at the vote totals for Trump, there is a different story. In 2012, Romney won about 92,000 votes in Philadelphia. This year, Trump won about 106,000. Clinton held her ground in the state's largest city but came away with a net loss of 9,000 votes compared to four years ago.
In fact, when you look at the 12 counties that Obama won in 2012, Clinton attracted slightly more overall votes than Obama, 1,906,759 vs. 1,887,241, a gain of 19,518 votes for Clinton. At the same time, Trump took significantly more votes than Romney (1,210,914 vs. 1,128,265), with a difference of 82,649 votes for Trump (a net loss of 63,131 votes for Clinton). When broken down, Clinton received more votes than Obama in 8 of the 12 counties, only losing four counties by a combined 31,630 votes. This includes a surge of votes for Clinton in mostly urban counties such as Philadelphia (3,518 votes over Obama), Allegheny County (14,866), and Montgomery County (23,503).
In the 12 counties that Obama won, voter turnout was up slightly from 2012, however not enough to offset the massive increase in more rural parts of the state. Looking at these mostly urban counties, voter turnout was up 3% from 2012. However, turnout also increased from 2012 to 2016 by 5% in more rural counties.
While Clinton was improving slightly over Obama in a handful of counties, 22 counties moved from Romney winning 50% to 60% of the vote to Trump winning with more than 60% four years later. For the Clinton campaign, this means that while they generally did what they needed to do among the Obama coalition in more urban and previously blue counties, they did not do well enough to offset the surge of Republican voters in the numerous rural counties. Looking at the counties that Romney won in 2012, there were 128,448 overall more votes cast in 2016. Of those counties, Trump took 210,709 more votes than Romney and Clinton lost 82,261 votes from Obama's totals. At the end of the day, there was no expectation that Clinton was going to win these counties, but she needed to keep the deficits much closer to be able to have a chance to win.

2016 (Source: The New York Times)

OHIO
In Ohio, Trump beat Clinton 52% to 44%, Johnson received 3% and Stein received 1% of the vote. In 2012, Obama beat Romney 51% to 48% in the Buckeye State. From a quick glance at the maps below, we see Clinton lost a lot of counties that Obama won in 2012 in northern and northeastern Ohio (8 total in this area). Further, Clinton’s victories were isolated to counties home to larger urban populations, such as those housing the cities of Toledo, Cleveland, Cincinnati, and Columbus. Trump’s victory was solidified by 454,983 votes.
Looking at the demographics of the state, the shift from 2012 among white women is by far the most shocking datapoint in Ohio. Though remaining consistent in terms of voter makeup (38%) across the elections, more white women voted for Trump (56%) than voted for Romney (53%), and significantly less voted for Clinton (39%) when compared to Obama (46%). The narrative before the election was one that assumed women would be more drawn to Clinton considering her historic run as a female nominee, and pushed away by Trump’s controversial rhetoric over harassment and his treatment of women. Obviously, there are other voter attitudes and cultural beliefs that were overlooked or not accounted for, and it clearly affected the election in ways that the political world failed to pay attention to or take seriously.
Among white voters overall, Clinton lost 8 points compared to the Obama coalition of voters (33% to 41%) and Trump gained 5 points from the Romney coalition of voters (62% to 57%). We also see a very similar pattern in Ohio among non-college voters as we did in Pennsylvania. While non-college voters accounted for less of the voter makeup than they did in 2012 (56% compared to 60%), as a group they dramatically shifted away from the Democratic candidate and towards the GOP. In Ohio, Democrats performed 9 points worse among non-college voters (44% vs 53%), and Republicans increased their vote share by 6 points (46% vs 52%). Despite making up a larger share of the vote, college graduates backed Trump just slightly more than they backed Romney (52% vs 51%). However, unlike in Pennsylvania, Clinton failed to make up Obama’s share of the vote among college graduates in Ohio, dropping by 6 points (47% to 41%).

Back in May, we came up with hypothetical situations in which Trump would win the election. One of those situations involved him excelling with the white vote in states like Ohio. In a move we considered generous, we said in this situation he would also match Romney’s percentage of the vote among minorities. Our thinking at the time was that it would be nearly impossible for Trump to grow his support among white and minority voters at the same time given his divisive rhetoric. Above, we touched upon the surprising surge of Latino Trump supporters in Pennsylvania. In Ohio, Latino voters were one of the few demographic groups that Clinton performed better among than Obama. Indeed, she received the support of 67% of Latino voters compared to 54% that voted for Obama. At the same time, Black voters backed Trump in higher numbers (8%) than they backed Romney (3%). This increase in support was surprising, but not as surprising as the fact that their support for Clinton was 8 points lower than for Obama. Given the much larger proportion of Black voters versus Latino, all of the gains made among Latino voters were more than erased by the loss of support among Black voters.
Moving to geographic breakdowns, Trump dominated the share of the vote in the northeast portion of the state. In this region there were three counties that didn't just flip from Obama to Trump, but did so dramatically: Trumbull (6 point Trump victory, 22 point Obama victory), Ashtabula (19 points Trump victory, 12 point Obama victory), and Portage (10 point Trump victory, 4 point Obama victory). This is a portion of the state that borders northwestern Pennsylvania and has been devastated economically by similar conditions of lost jobs and closing industries. Moving just west to central Ohio, Clinton saw many of these counties slip away from her as well. Counties concentrated in this region where Obama won, and Clinton fell short include but are not limited to Lorain (.3% Trump victory, 14 point Obama victory), Erie (10 point Trump victory, 10 point Obama victory), Ottawa (20 point Trump victory, 4 point Obama victory), and Wood (9 point Trump victory, 4 point Obama victory).
These flips alone would have made the race close, but the increase in support over Romney in GOP counties sealed the deal. For example, in southeastern Ohio, voters were expected to back Trump, but the levels in which they did were shocking. Looking specifically at counties like Washington and Lawrence, we see a clear picture of Trump’s popularity. In Washington County in 2012, Romney beat Obama 59% to 39%, which equated to a margin of 5,588 votes. In 2016, Trump beat Clinton 69% to 27% by 12,060 votes. In Lawrence County, Romney beat Obama 57% to 41%, by 3,917 votes. In 2016, Trump beat Clinton there, 70% to 26% by 11,391 votes.
The vote in Ohio was a dramatic shift in allegiance as opposed to a change in overall turnout. Indeed, we saw an equal decrease in overall turnout of minus 4% from 2012 in both rural and urban counties in Ohio. There are three ways that this type of shift could happen. Either: 1) a whole new set of voters turned out in equal numbers to the ones that stayed home, that is new Trump voters replaced former Obama voters, 2) the same voters switched from supporting Obama to supporting Trump, or 3) a combination of the two. Our hunch is that it was a combo but more heavily on the side of changed hearts and minds.
As we saw in Pennsylvania, the margins in the big cities were unable to make up for the shifts in rural counties. Clinton fell short of Obama in two of the three counties home to major cities; by 36,979 votes in Cuyahoga (Cleveland), 921 votes in Hamilton (Cincinnati), and she slightly over performed Obama in Franklin (Columbus) by 10,307 votes. In 2012, Obama beat Romney by 103,481 votes in Ohio. In 2016, Trump beat Clinton by 454,983 votes. The roughly 10,000 votes that Clinton gained in Franklin County and even the loss in Cuyahoga would barley put a dent in the damage she suffered to Trump outside of these three counties. In the maps below, we can see just how strongly voters moved toward Trump. The light red in the 2012 map represents a 50%-60% victory for Romney, whereas the dark red in the 2016 map shows a 60%+ victory for Trump. Looking at this another way, if we take away the big three counties, Romney won 1,057,595 votes. Four years later Trump won 1,302,268 (an increase of 244,673 votes). At the same time Clinton won 847,285, while in 2012 Obama won 1,161,076 (a decrease of 313,791). As we said before 10,000 votes here and 10,000 votes there add up.

2016 (Source: The New York Times)

MICHIGAN
As of the writing of this memo, Trump beat Clinton by less than 1 point in Michigan, 47.6% to 47.3%, while Johnson received 3.6% and Stein 1.1% of the vote. In 2012, Obama beat Romney by 9 points, 54% to 45%. In Michigan, we saw a similar surge of Republican votes across ethnic groups. Trump bested Romney's support by 2 points among white voters (57% to 55%), 1 point among Black voters (6% to 5%), and 4 points among Latino voters (38% to 34%). At the same time Clinton lost even more ground among white (8 points), Black (3 points), and Latino (4 points) voters. We see a similar trend in Michigan among non-college voters, as we have already mentioned in the other two states. Indeed, Trump gained 6 points compared to Romney (49% to 43%), and Clinton dropped 11 points from the Obama coalition (56% to 45%) among this cohort.
The shift from 2012 to 2016 among white men in Michigan was extraordinary. In 2016, Trump gained 6 points from the Romney coalition among white men and Clinton lost 12 points from the level of support Obama received. Interestingly, white men consisted of 36% of the voter makeup this year, 2 points down from 2012 (38%), suggesting that rather than bringing in a surge of white male voters, Trump’s campaign convinced many prior Obama supporters or non-Romney supporters to vote for him. It is possible that there was an entirely different set of white voters showing up this year versus four years ago, however as we discussed above, we feel there is a lower probability of this being the case.
In Michigan, Black voters made up 15% of the vote share in 2016 and 16% in 2012. We don’t see a dramatic change in terms of the Black vote, who continued to vote for the Democratic candidate overwhelmingly. In 2012, 95% of Black voters supported Obama and 92% did so for Clinton in 2016. However, Trump did manage to increase his support by 1 point among Black voters in Michigan compared to Romney, 6% to 5%. Perhaps more surprisingly among Latino voters, who made up a larger share of the voter makeup in 2016 than they did in 2012 (5% to 3%), Trump increased his support by 4 points compared to Romney (38% to 34%).

Looking at the maps below, it’s hard to miss the significant change in southern Michigan. Here, we see neighboring counties flip from blue to red. When taking a closer look, Obama narrowly won most of these flipped counties in 2012. Counties in central Michigan, such as Isabella (Obama had a 9-point victory) and Saginaw (Obama 12-point victory) had much more dramatic movement away from Clinton, who lost by nearly 4 points in Isabella and just over 1 point in Saginaw.
More urban counties were also not as favorable to Clinton. In Wayne County, home to the city of Detroit, Clinton beat Trump (67% to 30%) just shy of Obama’s margin of victory over Romney (73% to 26%), but in Muskegon County, just northeast of Grand Rapids, Obama beat Romney 58% to 41%, while Clinton was just barely able to edge out Trump, 47.5% to 46.6%. Looking at the four more urban counties, Clinton won a little over 1,073,000 votes compared to Trump's 671,100. However Clinton's numbers represents a drop of 121,000 votes from Obama's total, while Trump increased his support by almost 33,000 votes. To make matters worse for Clinton, if we take away Wayne County (Detroit) as well as Washtenaw (Ann Arbor), Oakland, and Genesse (Flint) Counties, Romney won in the remaining counties by 280,277 votes. Trump won 535,674, a gain of 255,397 votes. Clinton, on the other hand, received 205,453 less votes than Obama.
A clear piece of the puzzle for Trump’s victory in Michigan was reflected in the counties that fall on the southern border of the state. In nearly all of these counties (looking at the map they fall in a straight line along the southern border), Trump outperformed Romney while Clinton underperformed Obama. Focusing on the counties with greater populations such as Berrien, Monroe, Lenawee, and Calhoun, we can see just how dramatically these voters favored Trump to Clinton. In 2012 in Berrien County, Romney beat Obama 53% to 46%, by 4,744 votes. In 2016, Trump beat Clinton 54% to 41%, by 9,156 votes. In perhaps the most dramatic shift, Trump flipped Monroe County after Obama narrowly beat Romney by just 717 votes (50% to 49%). Trump took 58% to Clinton’s 36% of the votes in Monroe County in 2016, winning by a remarkable 16,396 votes. Monroe County is located north of the Toledo metropolitan area, and has an extensive history as the home to the Monroe Power Plant, one of the largest coal firing plants in North America, as well as various factories and industries owned by the Ford Motor Corporation. Before the election it would not have been outlandish to argue that given the Obama administration's efforts to save the auto industry, Clinton, who as a member of his White House team could have taken credit for supporting the efforts, especially since Trump announced he opposed the 'bailout', would have at least matched his support in Monroe. A swing of 17,000 votes would probably have been viewed as crazy talk. In the neighboring county of Lenawee, Trump also saw a surge in support as the county was narrowly won by Romney by 577 votes in 2012, and 9,678 by Trump in 2016.
As has been the case in the previous states we examined, the turnout patterns were not out of line with expectations. In fact, in Michigan, voter turnout was down from 2012 in both rural and urban counties. However, the urban counties saw a slightly greater decrease in turnout, minus 5%, compared to more rural counties at minus 1%.
As we discussed in Pennsylvania, what we are seeing in these states is momentum towards Trump in areas that were either less favorable toward Romney and/or even more favorable towards Obama. Consequently, many of these counties represent the heart of so much of the turbulent economic and cultural worries that Trump spoke to with such vigor. It is clear that the Clinton campaign (and most others) missed the level of connection Trump had with voters in these areas, and the campaign thought they just needed to match Obama's vote totals in the more urban and suburban areas to guarantee a win.

2016 (Source: The New York Times)

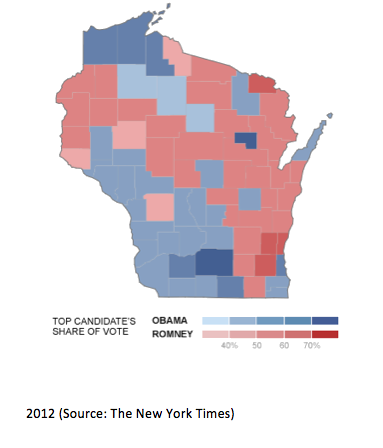
WISCONSIN
On election night, Wisconsin quickly became one of the most crucial states once it became clear that Clinton was unlikely to win Florida or North Carolina. Wisconsin was won comfortably by Obama in 2012 and was a state that Clinton needed to win to make the path to 270 electoral votes a mathematical possibility. Given the past election results, it was hard to imagine that Wisconsin would not stay blue, but in a night of surprises this clearly did not happen. Clinton ended up underperforming Obama by 231,740 votes, while Trump increased his vote total by just 721 votes over Romney.
In the Badger State, when it came to white and Latino voters, Trump barely edged out Romney, receiving a slightly higher number of votes among white (53% to 51%) and Latino (34% to 31%) voters. Among Black voters, there was no change between Romney and Trump. The more dramatic shift comes when you look at voters by their education level. In 2016, college graduates made up a slightly larger percent of the voter makeup in Wisconsin when contrasted with 2012 (45% to 42%). Among this cohort, Trump saw a 7-point drop in votes compared to four years ago, while Clinton enjoyed a 2-point increase. At the same time, non-college graduates made up a smaller proportion of the electorate overall (55% versus 58%) but Trump outperformed Romney by 9 points (56% to 47%). To make matters worse, Clinton came in 11 points lower than the Obama coalition four years ago (40% to 51%).

In Wisconsin, we saw the most dramatic flip in the southwestern portion of the state. A corner that, in 2012, was almost entirely blue flipped with the exception of Dane County, home of the liberal hub of Madison and its neighboring counties Iowa, Green, Rock, and Sauk. The only other areas of the state to remain blue are three counties in the upper western part of the state: Eau Claire County, Menominee County, which is home to the Menominee Reservation, and Milwaukee County. In the two counties home to Wisconsin’s most populated urban hubs, Dane County (city of Madison) and Milwaukee County (city of Milwaukee), Clinton received a greater percentage of the vote share but less raw vote counts than Obama. In Milwaukee County, Clinton handily beat Trump with 66% of the vote compared to his 29%. However, when we look at the number of ballots being cast, Obama received 328,090 votes while Romney received 158,430, which comes out to 67% for Obama and 32% for Romney. In 2016, Clinton received 288,986 votes in Milwaukee County while Trump received 126,091. To put this in context, Clinton under performed Obama by 39,104 votes in Milwaukee County. According to CNN’s count of raw votes, Clinton lost the state by 27,257 votes. In this election cycle, voter turnout was down from 2012 in both rural and urban counties in Wisconsin. Urban counties however suffered a slightly greater loss in turnout, dropping 10% from 2012, whereas more rural counties dropped 7% from 2012.
As we have seen in the other states we’ve focused on, Trump’s victory was influenced by several factors. Clinton’s inability to match the Obama coalition is certainly one of them, but another factor to consider is the margins Trump gained over Clinton while often surpassing Romney’s margins of victory in already red counties. In Wisconsin, nearly the entire southwestern portion of the state changed color (as illustrated by the maps below) from 2012 to 2016. This obvious surge in Trump support is likely a result of Trump’s message in historically industrial, working class areas, (what we have referred to as the “heart of the rust belt”) experiencing both economic and cultural frustrations. While many counties shifted from red to blue, we also saw already red counties becoming even stronger for the GOP. Take for example the more populated counties in central Wisconsin, namely Marathon and Chippewa. In 2012, Romney beat Obama 53% to 46% in Marathon County, by just 4,238 votes. In 2016, Trump beat Clinton 57% to 39%, by 12,534 votes. In Chippewa County, Romney beat Obama 50% to 49% by only 160 votes. In 2012, Trump beat Clinton 57% to 38%, by 6,037 votes. These two counties represent a 23,000 vote shift, again in a state where Clinton lost by about 27,000 votes.
In fact, if we look at the numbers across the state, when we take out Dane and Milwaukee Counties, we see that Clinton received 150,225 less votes than Obama, while Trump increased his vote total by 82,236 votes over Romney. The story in Wisconsin points to a Clinton loss more than a Trump victory, although at the end of the day this differentiation is meaningless.

2016 (Source: The New York Times)
Conclusion
When we begin to dive into the voter files, we will have a deeper understanding of who came out to vote and who decided to sit the election out. Until then, our look at exit polls and county breakdowns opens the explanation on Clinton’s stunning loss. We predicted that the Rust Belt states would be key to any chance that Trump had at the presidency. As it turns out, his message hit hard in these states, especially among white and non-college voters who, as we have explained, shifted dramatically towards Trump in 2016. One thing that is puzzling is the failure on behalf of the Clinton campaign to anticipate the eventual results and target these states. As Ron Brownstein of the Atlantic Magazine notes,[2] Clinton invested significantly more money and resources into swing states that she did not need to win, i.e. Florida, North Carolina, and Ohio ($180 million) and by contrast only spent $16 million in Michigan, Wisconsin, and Colorado (a state she ended up winning). As we’ve discussed, it seems safe to say that Michigan and Wisconsin decided the election and were a part of a larger national issue for Clinton among mainly white but also many minority voters who, for whatever reasons, were more willing to take their chances with Trump than vote for an establishment Democrat.
[1] The Washington Post. https://www.washingtonpost.com/news/the-fix/wp/2016/11/15/the-counties-that-flipped-parties-to-swing-the-2016-election/
[2] http://www.theatlantic.com/politics/archive/2016/11/how-trump-won/507053/